
This is the first part of the talk I gave at researchED London 2019. It is almost entirely based on work I completed with Dave Thomson at FFT Education Datalab. All the smart bits are his and the errors are mine!
Have you ever read so much and thought about something so hard, that you are no longer sure what you think? I have been studying school admissions and measuring school performance for over 15 years now, and yet, when it came to choosing a school for my own children I wasn’t able to translate any of this expertise into an advantage in the industrious process of sifting through Ofsted reports and performance table rankings. In fact, unlike my peers, I didn’t bother doing any of that. I know *so much* about measuring school performance that I understand the fallibility of the individual judgments we make on schools.
I really do think that ‘nobody knows which schools are good’. I use the word good advisedly. We do know which schools are exceptional and we do know which schools are in desperate need of support to improve. But that leaves a massive pile of schools somewhere in the middle of league tables that we can say little about, in my view.
In this post, I want to describe what’s gone wrong in measuring school performance. In the post that follows, I pitch a radical plan for fixing this.
This is a story about the tools that government uses to measure school activities and their impact. I’ll be describing three ways in which these tools not only fail to measure the things we value, but in doing so they distort the quality of education that schools choose to deliver.
1. What gets tested gets taught
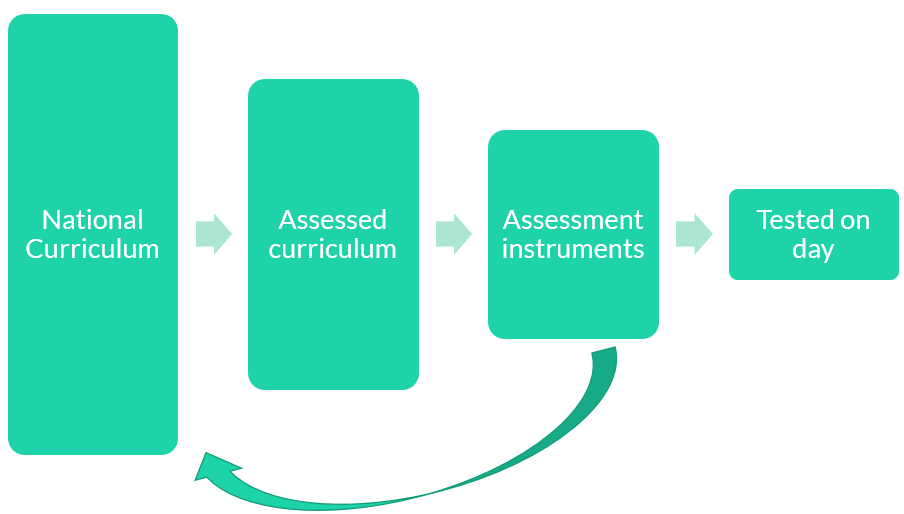
Test scores can never provide a direct and complete measure of educational achievement. They are necessarily incomplete measures, proxies for the more comprehensive measures that we would ideally use but that are generally unavailable to us. In England, we flick through the National Curriculum and select some subject areas to be assessed. We then announce exactly where, when and how these subjects will be assessed. Having done this, we sample from that specification to create assessments each year.
Now this sampling from the broad National Curriculum down to the annual test papers wouldn’t be such a concern were it not for the wash-back of the publication of the assessment instruments, which creates a serious divergence between the intended and enacted curriculum.
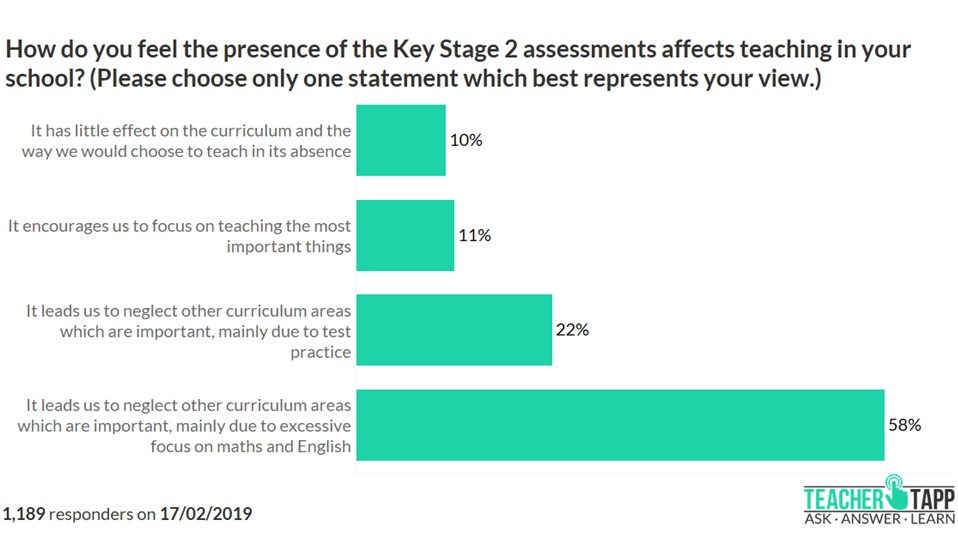
This manifests itself in quite different ways across the phases of education. In primary schools, the Key Stage 2 tests assess very few subjects and those that are not tested are understandably neglected. We know, for example, that the removal of the Year 6 science test has led to falling numbers of students meeting expected standards in science at age 11. And a Teacher Tapp poll of primary teachers suggests 9-in-10 think the presence of the Key Stage 2 tests impacts decisions about what they choose to teach.
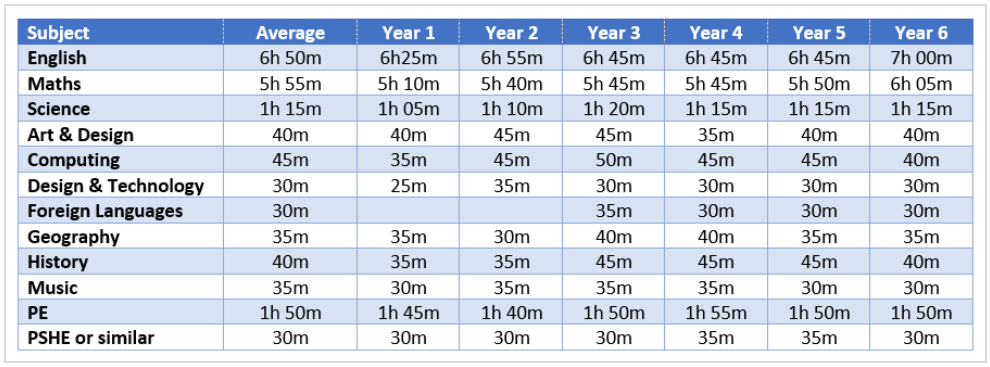
A recent survey by Michael Tidd has documented the huge proportion of lesson time in primaries that is now devoted to maths and English, to the expense of everything else. School performance is a zero-sum game which inevitably produces a race to the bottom in squeezing out the non-examined curriculum.
Now, I care a great deal about literacy and numeracy. But I’ve got no idea whether or not I should want to send my child to a school that performs well on SATs because it tells me nothing about the extent to which the school has created a restrictive curriculum diet to achieve those ends.
Secondary schools are in quite a different position because there is relatively little divergence between the intended Key Stage 4 curriculum and the one we assess. We examine all KS4 subjects (save a little exercise and PSE) using nice long assessments that can measure many dimensions of student knowledge and skills.
However, this doesn’t prevent washback onto the parts of the KS3 curriculum that will not be tested, with around half of schools removing a third of a student’s entitlement to study a broad curriculum to age 14. It is easy to persuade yourself that you don’t need to teach it when you know it won’t be tested!
And at KS4, we dance to the tune of ‘the curriculum we plan to test’, switching between qualifications as they fall into, and out of, performance tables. This game includes finding qualifications with generous points allowances within a subject. For example, at its peak a quarter of all 16 year olds were taking the BTEC science rather than a standard GCSE and many secondary schools forced all students to take this vocational qualification.
The game also means selecting subjects based on the schools’ interest rather than the students’ academic interest and needs. The European Computer Driving Licence has finally been removed from performance tables, knocking about 0.15 off the Progress 8 scores of those schools who once had 100% entry rates. However, other tricks remain. In 2018, there were 10 schools who achieved a Progress 8 score in the open bucket that was at least 1.5 grades higher than that they achieved in the other buckets. How? By ensuring all students took BTECs rather than GCSEs for their non-EBacc subjects. I like BTECs, but they weren’t designed as universal qualifications to suit 16 year olds who plan to follow an academic curriculum to age 18 or 21. Even worse, many headteachers are privately comfortable that their students do not opt to take modern languages since French, German and Spanish GCSEs are amongst the least generously scored compared to other subjects.
Nobody knows which schools are good because… what gets tested gets taught, leading to distortions in the delivery of an appropriate National Curriculum in both primary and secondary schools.
2. Teachers have discretion over administration
At the end of 2018, a headteacher and two of their staff were forced to leave a London primary school after an internal investigation found that SATs papers had been systematically altered and missing answered added. It was in the ‘system’s’ interest – from the academy chain involved, to the Unions whose members were accused through to the Department for Education and Standards and Testing Authority – to claim that it was a one-off. Those of us watching the system from the sidelines believed otherwise.
The Department for Education defines maladministration as any act that leads to outcomes that do not reflect pupils’ unaided work or actual abilities. Whilst rumours abound that ‘maladministration’ is common, the number of reported cases each year is tiny, though rising. Our system of accountability relies, in part, on teachers to administer the very tests and in-class assessments by which we will hold them to account. In a high stakes accountability system, where even the pay of teachers can depend on outcomes, this creates an incentive for teachers to influence scores for their own benefit.
Teacher administration of assessments is very common, especially in primary schools. This has consequences, where teachers desire the assessment to be the best possible reflection of what a child can do. Most famously, prior knowledge of the pass mark for the phonics test in the first two years of its administration led to an implausible spike in the marks distribution. For the teacher who is willing the pupil to pass, it is entirely understandable why so many borderline cases fell on the side of passing rather than failing.
The Key Stage 1 (KS1) assessments, which are now informal and teacher marked, are unusual because they act as a high-stakes outcome for infant-only schools and yet are the baseline to the Key Stage 2 (KS2) performance tables. Junior schools regularly claim that the KS1 scores assigned by infant schools are unrealistically high, making it hard for them to achieve good KS1-KS2 progress compared to all-through primary schools, which in turn had led to them being punished in Ofsted inspections. At FFT Education Datalab, we showed that this apparently poor performance of junior schools was most likely being caused by the all-through primary schools depressing their KS1 baseline results to achieve good progress scores. (We asserted this because the depression of KS1 was visible in primaries when the government removed the external assessment in 2003 and because the merger of infant and junior establishments quickly leads KS1 scores to fall.)
The SATs assessments that students sit in reading, writing, spelling and grammar, and maths at the age of 11 are far more formal. However, they are still sat by students in their own classroom or in offices, with resulting discretion over exactly how the classroom and seating are arranged and what is on the walls for students to look at. Schools are able to give students a reader or a scribe (or both) if they struggle to access the test paper (except they obviously cannot have a reader for the reading comprehension paper).
The guidelines are clear that this must only happen if it is consistent with ‘normal classroom practice’ for this student. However, survey data suggests that incidence of readers or scribes during SATs vastly outstrips the number of teaching assistants in Year 6 classrooms. It is simply not possible that all these students routinely have an adult sitting next to them helping them access school work. Where are all these readers and scribes appearing from? In part they are teaching assistants who are taken from other classrooms in the school for SATs week. How on earth did we get to the point where schools convinced themselves that this is legitimate ‘normal practice’?!?
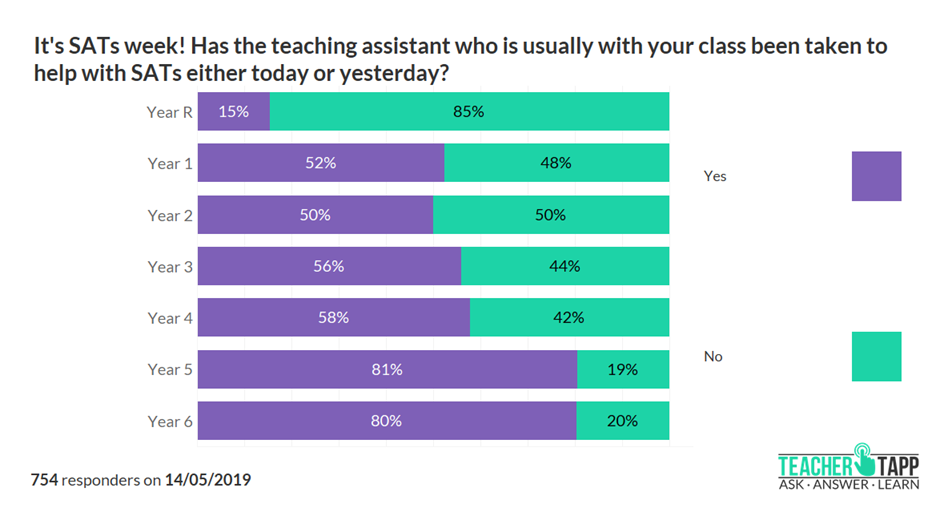
We tried to get an estimate of how many students had a reader and/or scribe for SATs from Teacher Tapp. This suggests it currently runs at over 1-in-10 students (which is similar to government estimates for extra time). We have a major problem if 1-in-10 eleven year-olds in mainstream education are not able to complete a maths assessment independently, since we’ll expect most of them to do maths unaided in secondary school lessons just a few months later.
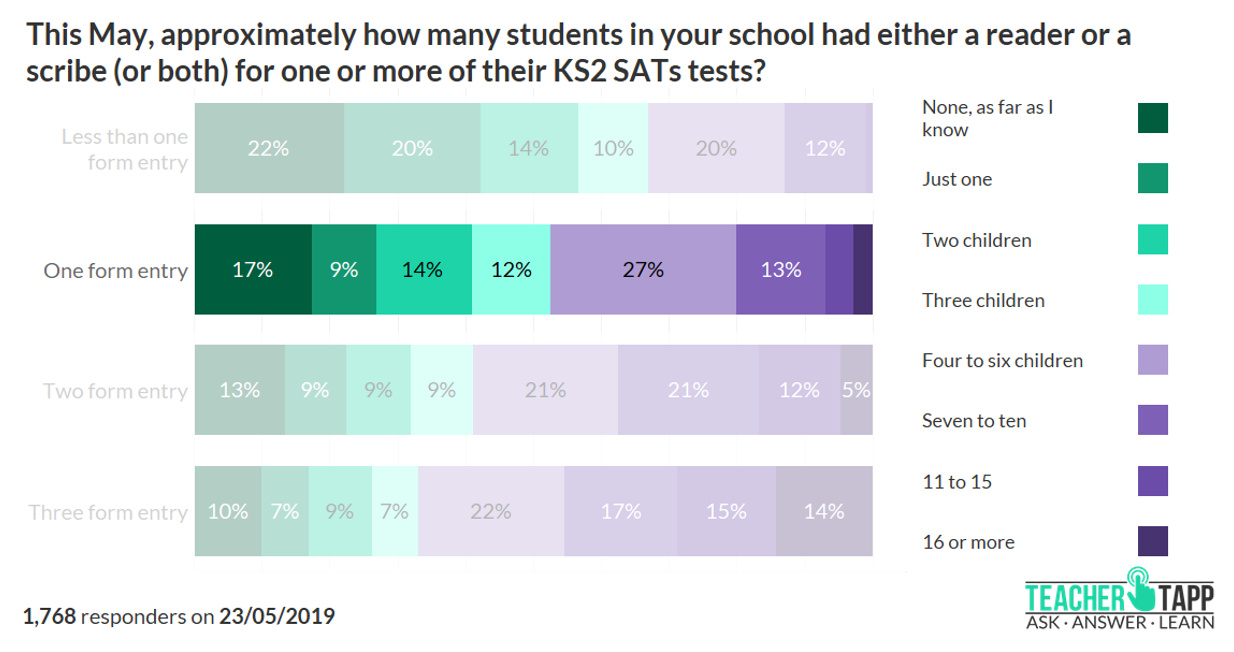
I actually suspect the value of having the reader is not just in the ‘reading’ but rather in the manipulation of student persistence as the adult coaxes them along. And since I’m certain that there is no consistent practice in how these readers and scribes are used across schools, there will be no consistency in how well the SATs measure student attainment either.
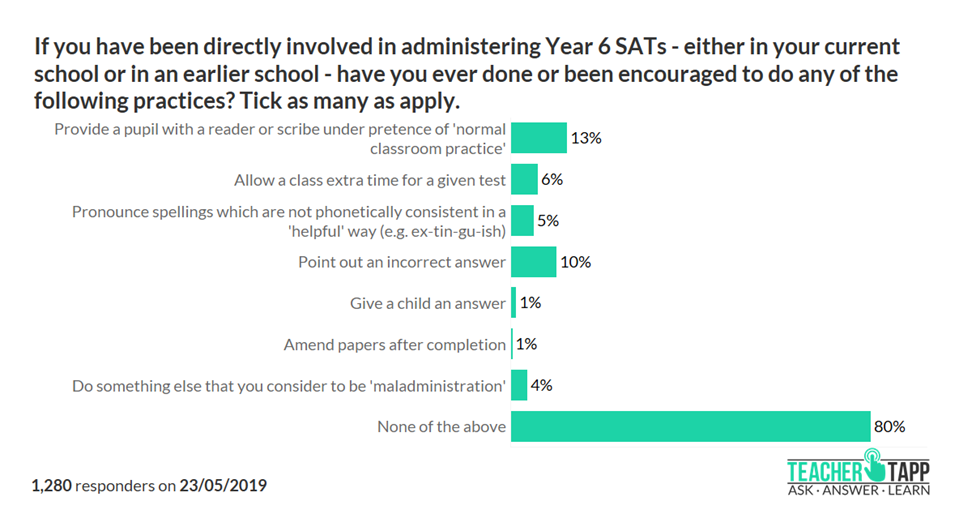
One issue here is that maladministration does not feel like explicit ‘cheating’. Instead, there are 50 shades of playing the system; ambiguous rules getting stretched to the extreme. If you want to understand why it is so easy to cheat in SATs, should you wish to, primary teacher Solomon Kingsnorth has listed all the ways that manipulation can take place. Teachers are surprisingly open on social media about how instances of maladministration happen in schools. In Teacher Tapp surveys, large proportions of teachers report that they have been asked to do something that constitutes maladministration during SATs.
This misuse of ‘extra support’ for SATs mirrors the way that applications for extra time in GCSE and A level examinations are unlikely to reflect true learning difficulties or need. For example, it has been reported that 28% of students in independent schools have extra help or extra time in exams, compared to just 8% of students in state-funded schools. Moreover, this manipulation of the SATs process contaminates estimates of secondary school performance as much as it does primary school performance. Indeed, it was phone calls from secondary heads asking for help to ‘prove’ that one of their feeder primary schools was cheating on SATs that led us to look into the data more closely at Education Datalab.
The overall prevalence and impact of these issues on the accuracy of school performance metrics has not been quantified, but it seems serious enough that teachers place little faith in KS2 SATs. Only 1-in-3 primary teachers think that SATs are a good reflection of pupil attainment and only 1-in-10 secondary teachers think that SATs are a good reflection pupil attainment.
Nobody knows which schools are good because… teachers have discretion over the administration of the very same assessments by which they will themselves be judged.
3. Schools can choose which pupils count
Shortly after we launched Education Datalab, I went to speak to the secondary heads in a London borough who wanted to know whether they really were ‘the worst schools in London’. We duly printed off all the data we had on their schools and set off to give them the bad news. However, the conversation took an interesting turn when they explained one reason why their exam results looked poor. “There are a bunch of Academies sitting on the boundaries of the Borough”, they explained. “They get the parents of their troublesome students in, give them the phone numbers of our schools, and tell them they’d be better off with us. We’re under-subscribed so happy to accept them, but they hammer our Progress 8 score.”
It is rare that an anecdote or two constitutes common practice, so we were cautious about believing their story would materially affect school performance. However, one of the nice things about the National Pupil Database is you can quickly quantify how common a phenomenon is. Within an hour of getting back to the office we could see that they were indeed right – their schools’ performances were being damaged by taking on poorly performing students just a year before their GCSE exams. The next day we began work on quantifying this phenomenon across schools nationally.
Since 2005, secondary school performance tables have been based on pupils who reach the end of Key Stage 4 (or rather the January Census). Any pupils who leave a school before this, for whatever reason, do not contribute to a school’s performance measure. This introduces a perverse incentive to manage off-roll pupils who are likely to be low achieving. Whilst this incentive has always been present, it is perhaps even greater as a result of using a value added measure, Progress 8, as the headline indicator within the accountability regime. A pupil who is unlikely to achieve any qualifications, as a result of school refusal, say, will contribute a large negative score.
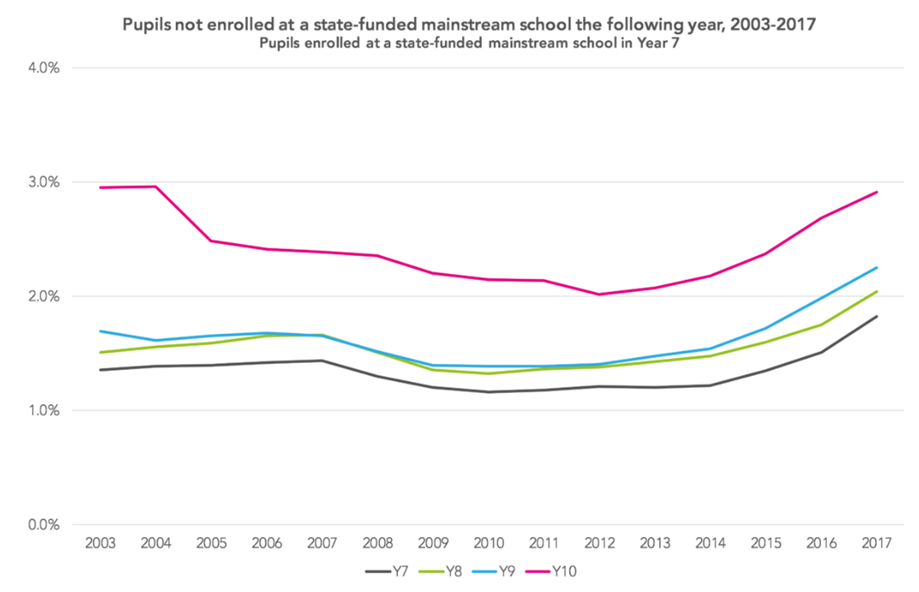
The chart below shows the incidence of pupils leaving the state mainstream sector entirely. Some leave to special schools or alternative provision, but data cannot distinguish those who leave for the private sector/overseas/through death from the more troublesome cases of movements to ‘home’ or unregulated schooling. There are two notable things about the chart: (1) numbers leaving the mainstream sector have been rising since 2012; (2) the numbers leaving in year 10 are considerably higher than in years 7-9.
At Datalab, we tried to quantify the impact this has had on performance tables in a number of ways. For some schools, the impact is quite extreme. Back in 2015, there was one school that would have seen its headline GCSE pass rate drop from 61% to 44% if we weighted each pupil’s contribution to school performance according to the number of terms they had spent at the school!
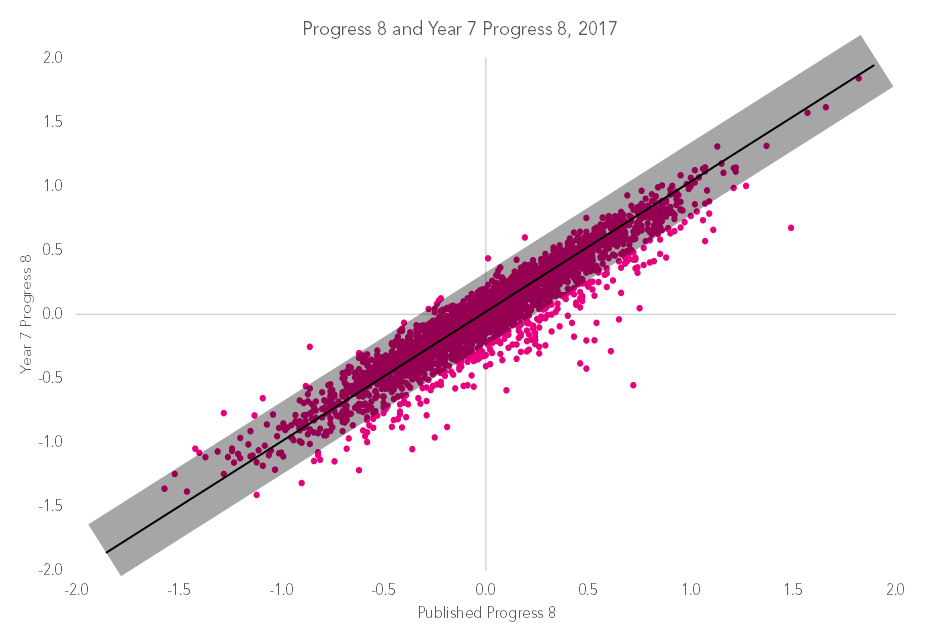
That said, the chart below which compares Progress 8 of students present at the start of Year 7 (regardless of where they completed their education) versus the Progress 8 of those present in Spring of Year 11 shows that, for most schools, pupil mobility in and out of their school doesn’t significantly affect how we assess its performance. (But there are extreme cases, including one of the ‘best performing’ schools in the country that somehow manages to lose dozens of students who achieve very little by way of GCSEs.)
We could easily change the rule of ‘who counts’ in school performance tables. For example, we could count all students present in Year 7 or weight pupils for time in school. But whatever rule we set for determining which students count will inevitably get gamed.
Nobody knows which schools are good because… schools can choose which pupils count, and some encourage under-performing and difficult-to-teach pupils to complete their education elsewhere.
Our attempts to measure school performance may incentivise schools to teach as well as they can, but they also undoubtedly distort and damage the quality of education that schools choose to deliver. Is it inevitable that we must live with this compromise, or is there an alternative approach to accountability to encourages everyone to simply teach the national curriculum to the best to their abilities?
This is the question that I will address in the next post!

Becky, as always, I enjoy your analysis of KS1/2 data which as a primary headteacher I have no trust in or respect of! Now I am a secondary MAT trustee, I am even more aware of the worthlessness of the data. But there is also a problem about knowing which schools are good because we fail to define goodness with any care. We have not just reduced the broad curriculum to a >50% En/Ma issue in our definition of a “good” education, but reduced the fullness of a “good education” to simple curricular provision. For all Ofsted’s “improvements,” the heart of what makes a school that does good to its children is still missed, and often depends on actually being there and getting a sense of the relationships, hospitality and care. I think we are a long way from accurately assessing a good school for these reasons too. But thanks so much for a fascinating post!
I agree! Wait until the next post where I take on issues of things that are difficult to measure (like the quality of extra-curricular provision, student enjoyment of school, and so on)!!!
Pingback: Wrestling with the Long Term Disadvantaged | @LeadingLearner
Pingback: The ungameable game – Becky Allen
Pingback: Careering towards a curriculum crash? – Becky Allen
Pingback: The voodoo art of ranking schools – Becky Allen
Pingback: Best reads of 2019 – PsychBrief